AI Chart Tools
工具列表

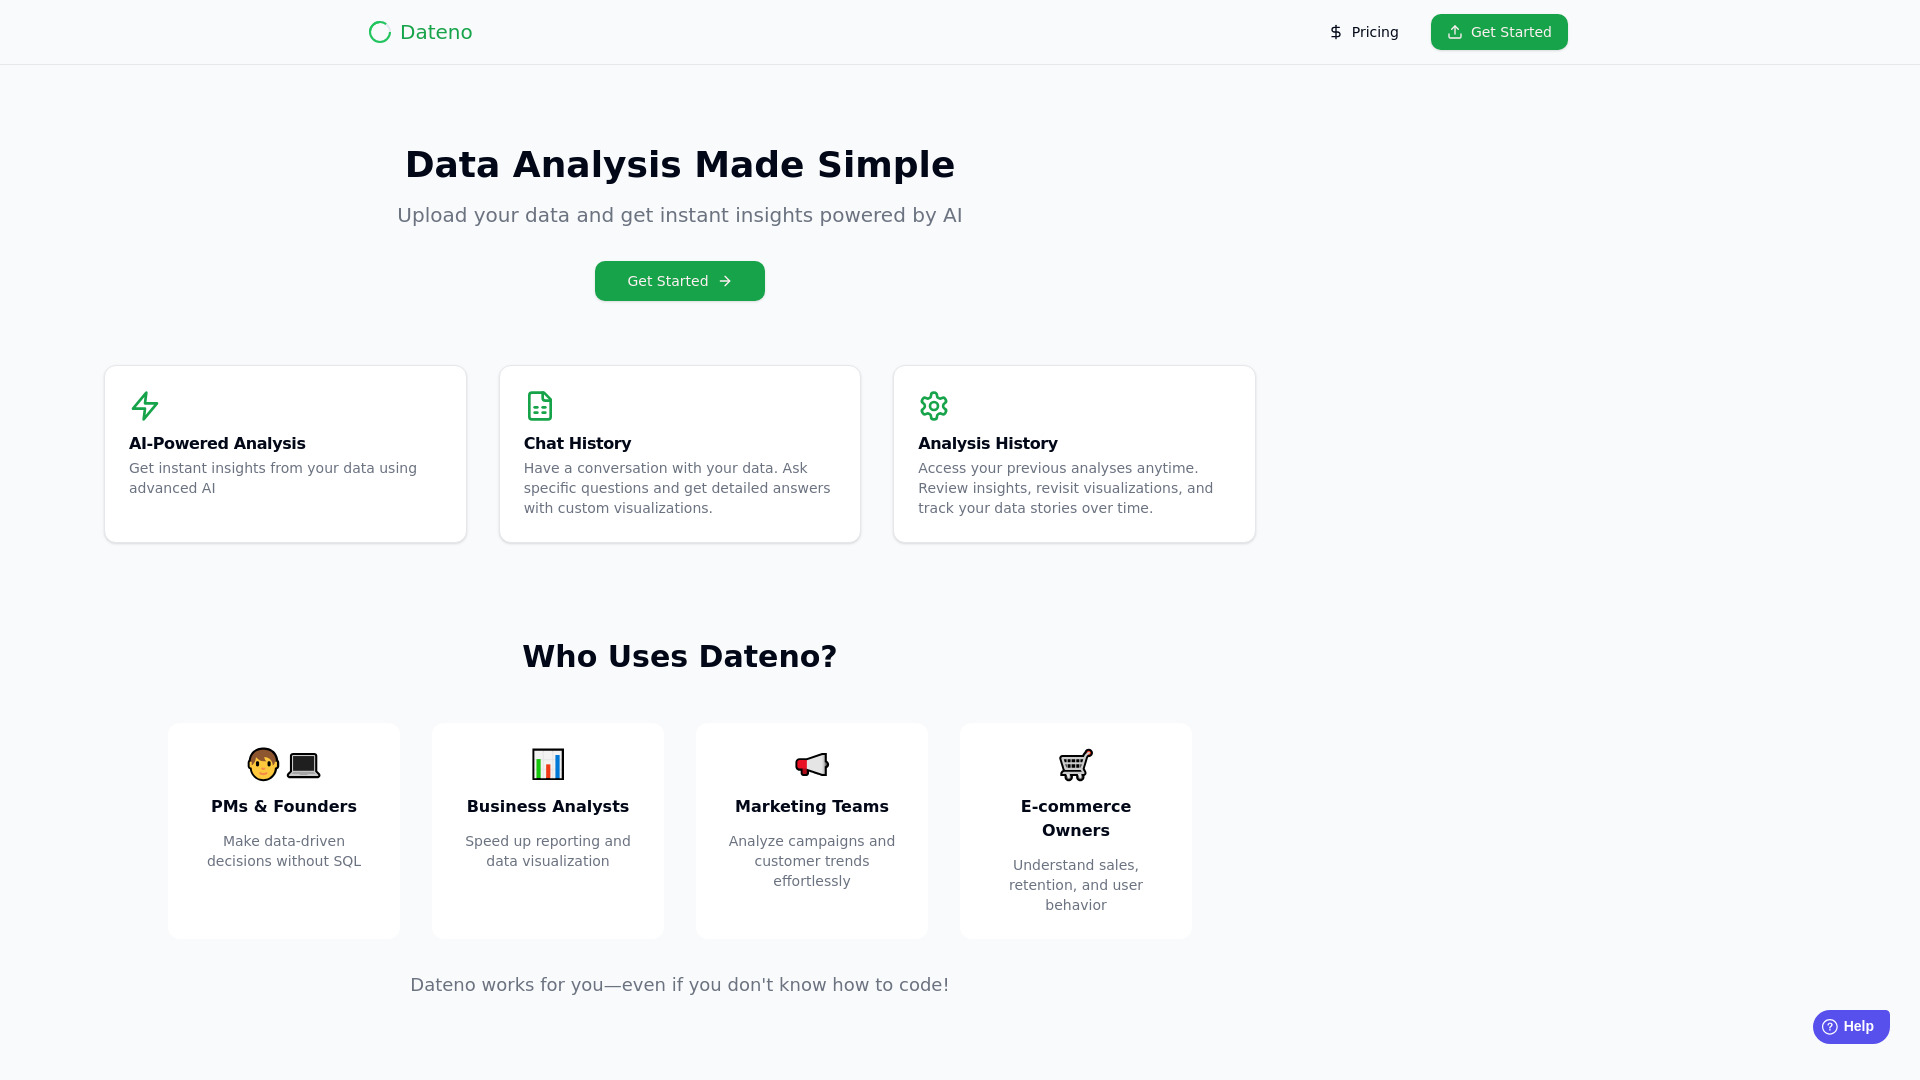

Conduit Copilot - AI analyst for business
Conduit AI integrates data sources and uses AI to analyze and visualize data for business insights.
查看详情
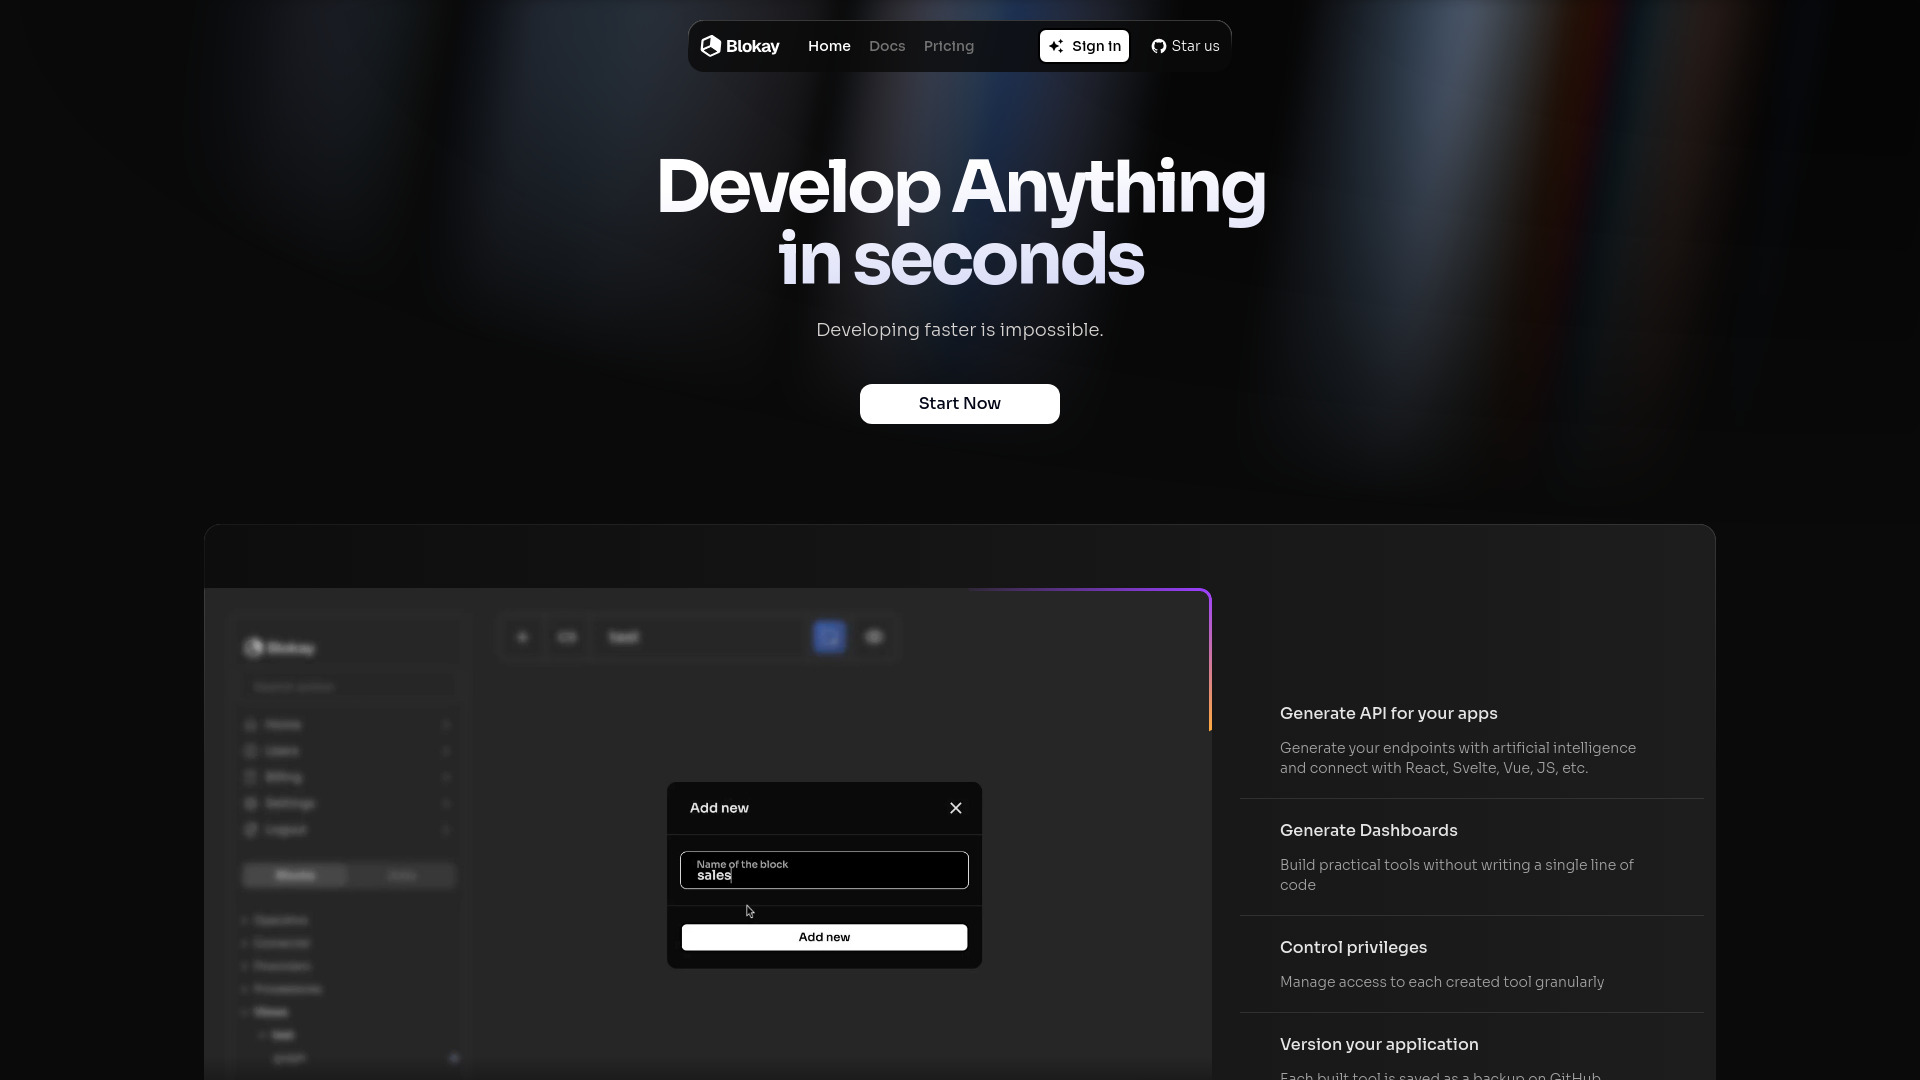
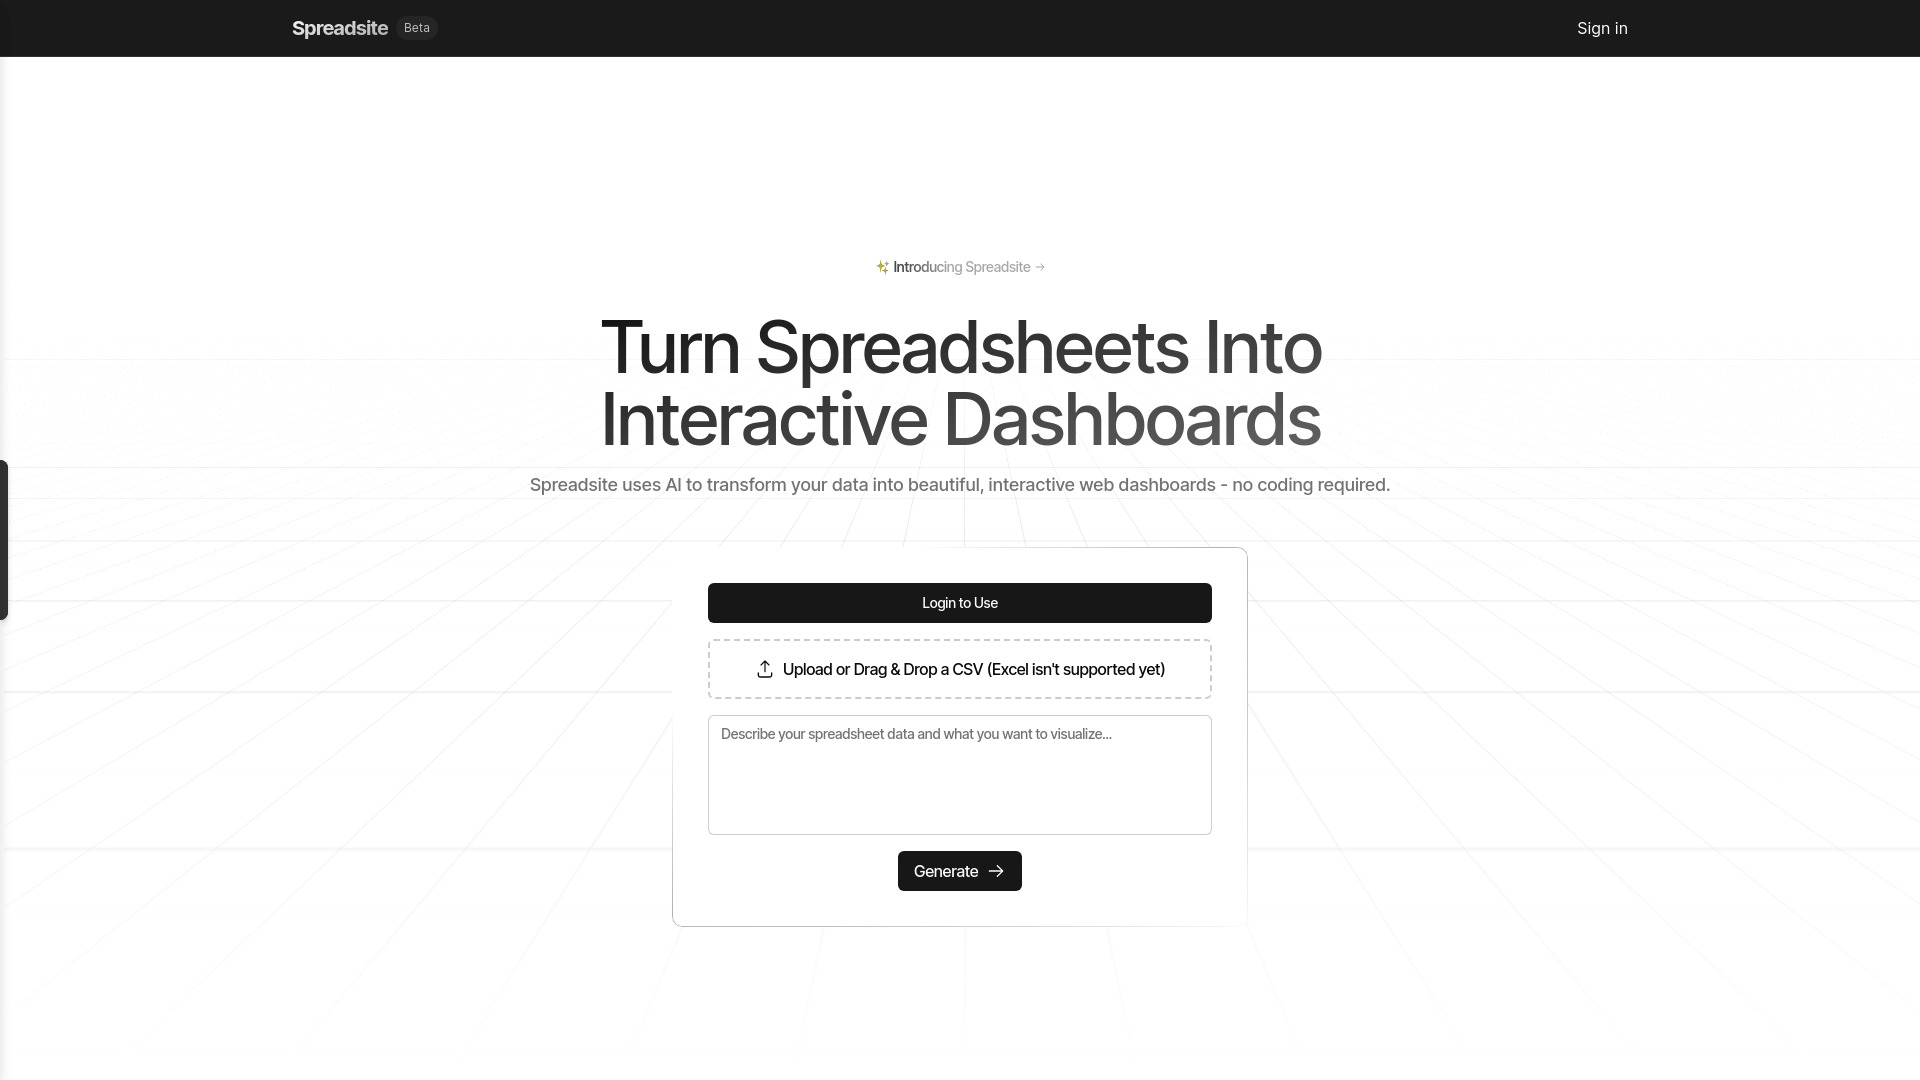
Blokay
Platform for creating dashboards and backoffices rapidly using AI-powered web components.
查看详情


Bync AI
Bync AI analyzes resumes and ranks candidates for simplified hiring, but is currently suspended.
查看详情
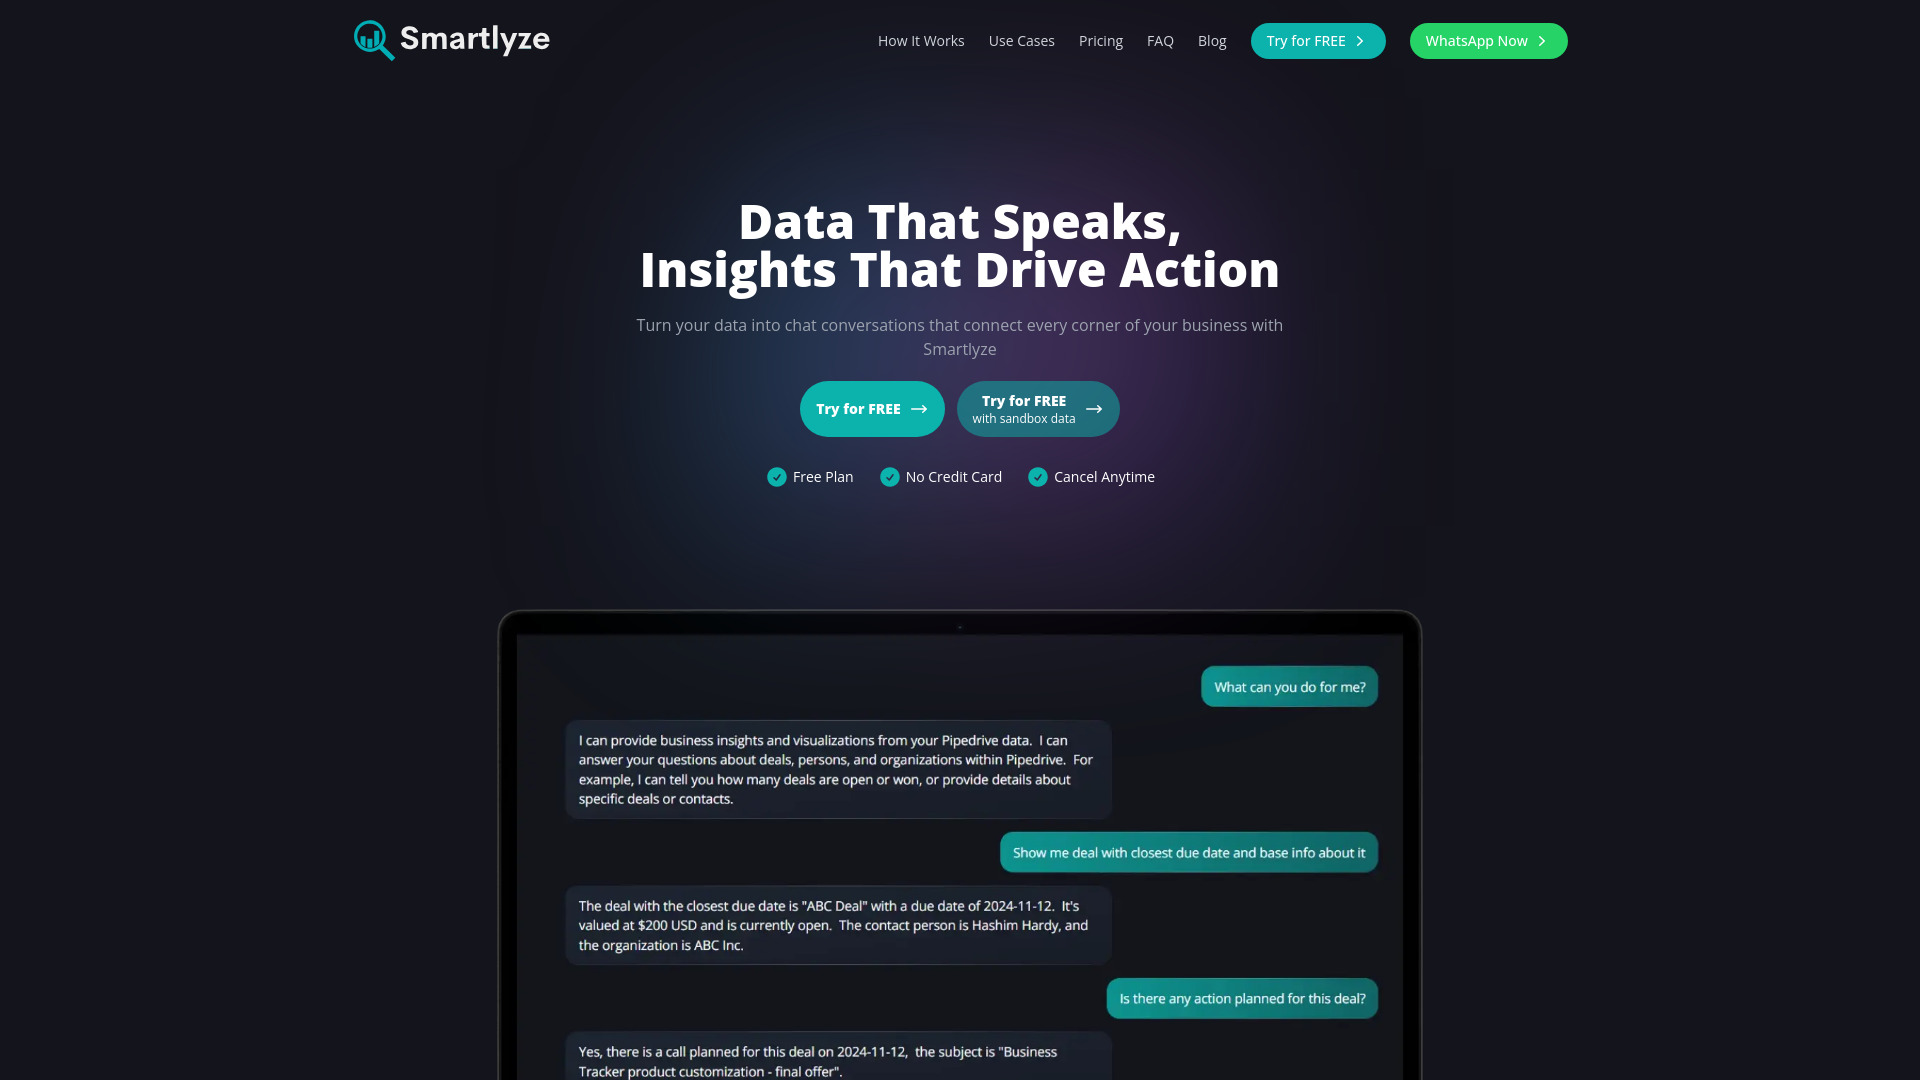
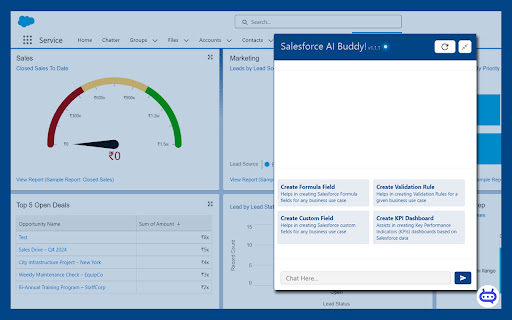
Smartlyze
AI-powered data analytics platform turning data into natural conversations for instant insights.
查看详情
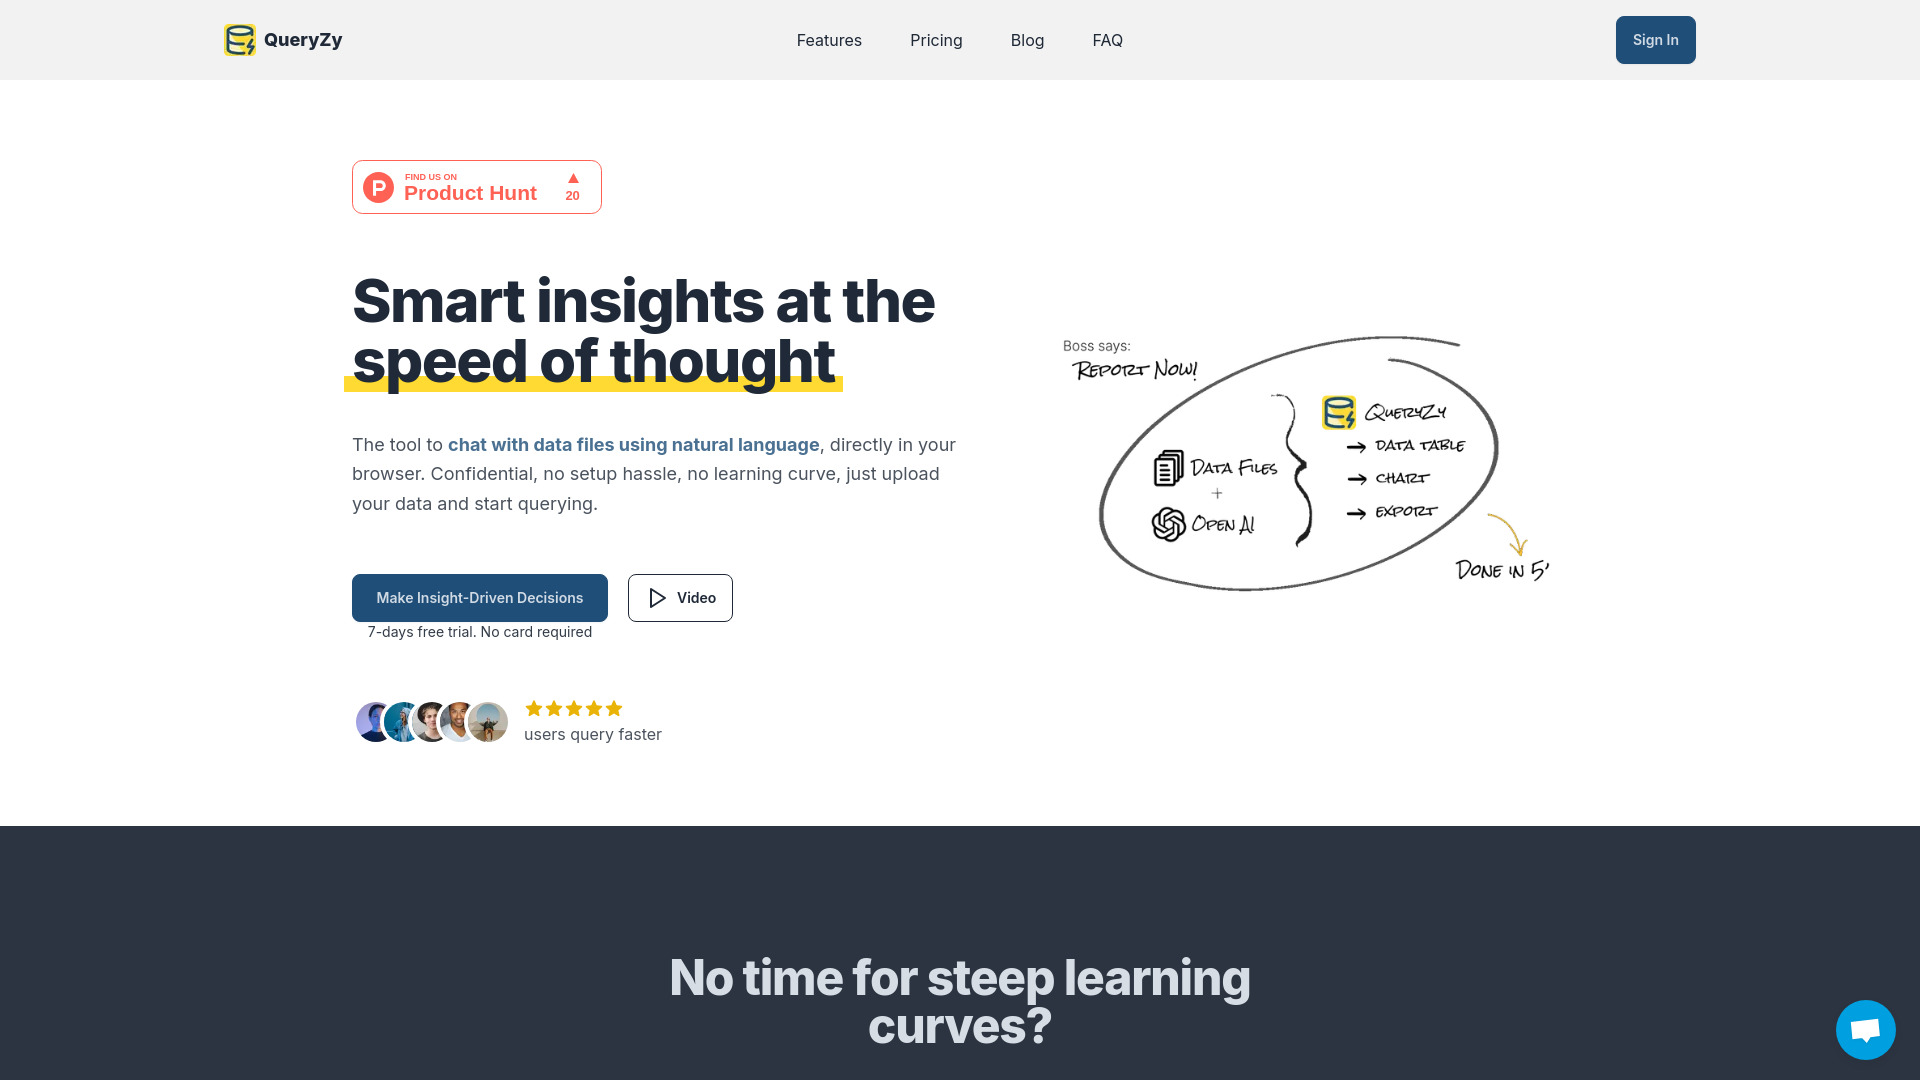
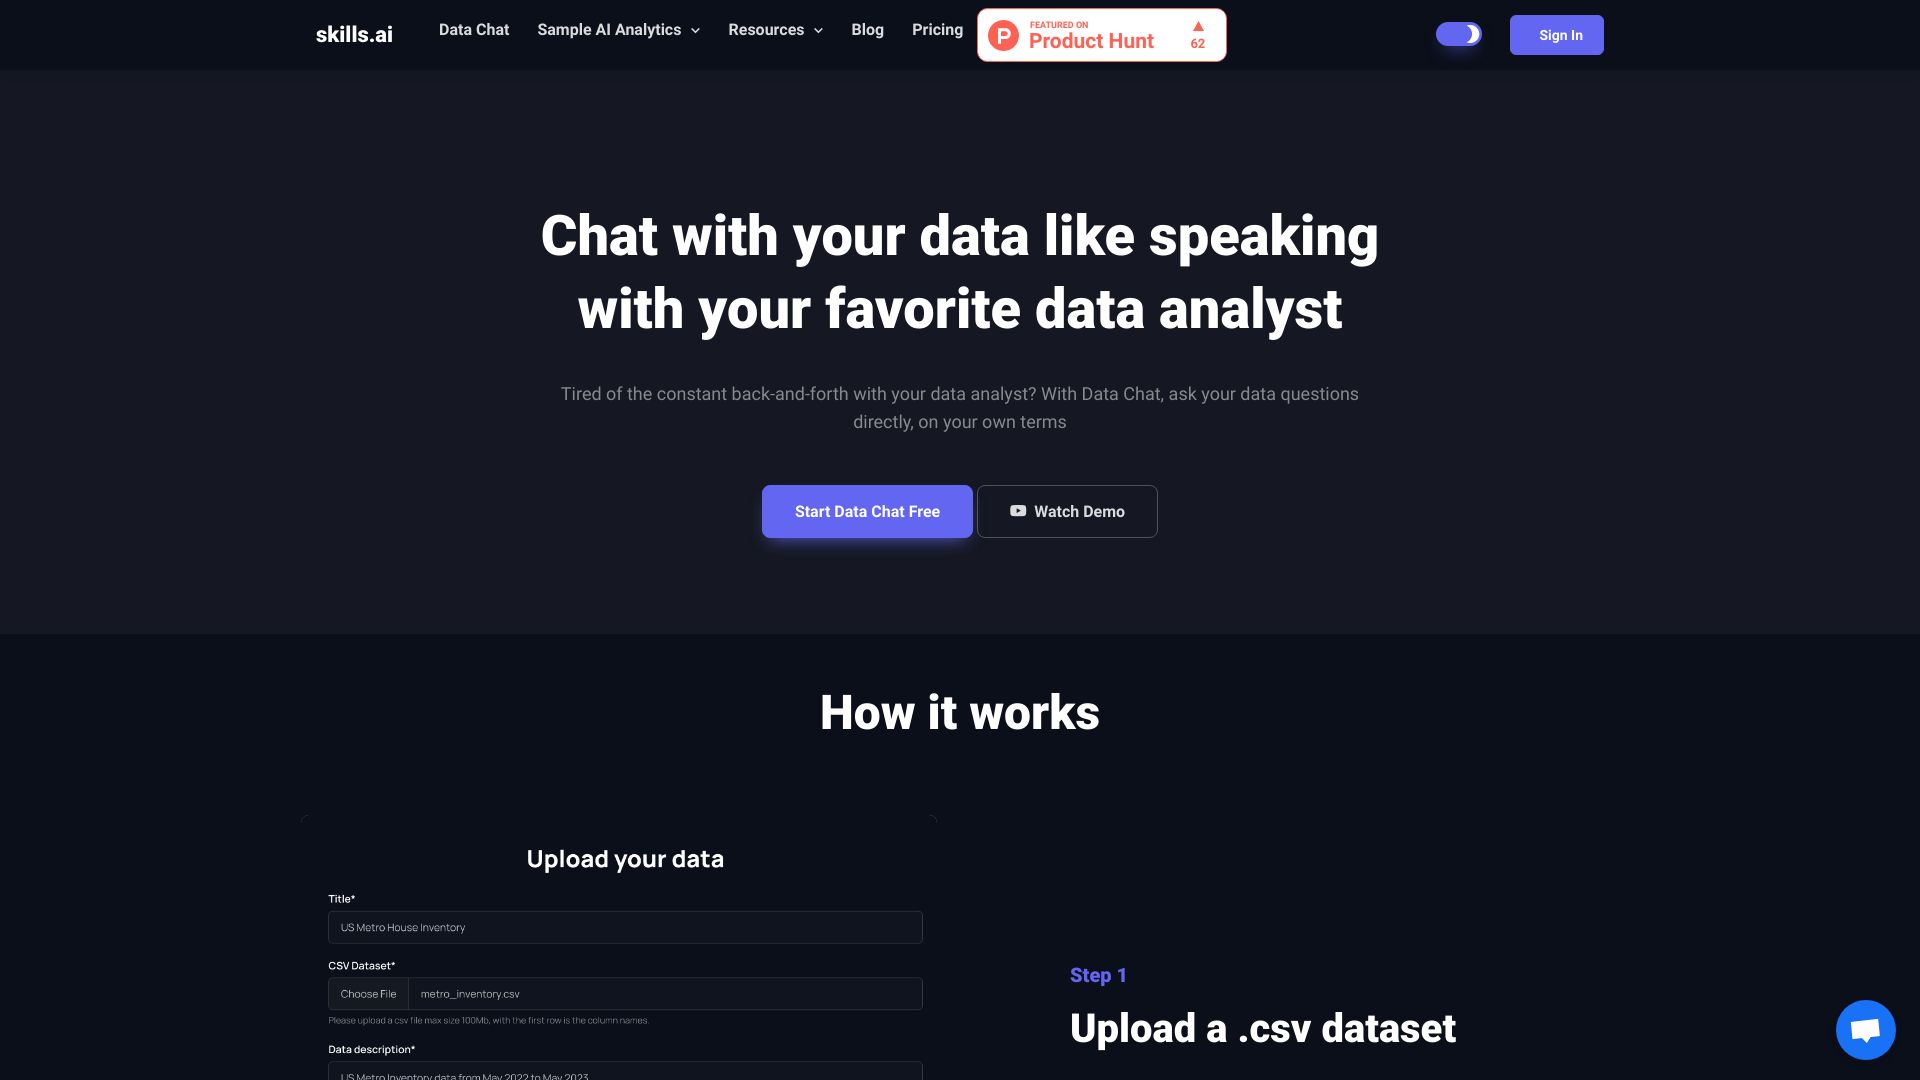
QueryZy
QueryZy: AI-powered data analysis tool enabling natural language querying and report building.
查看详情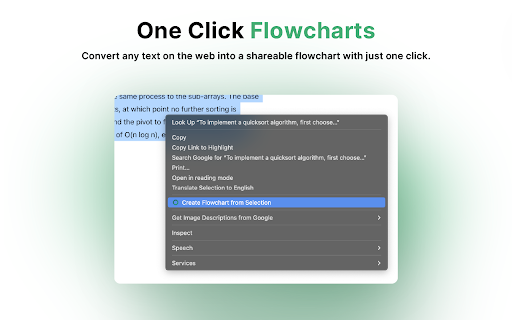
Flowsage Extension - Turn ideas into shareable flowcharts
AI-powered Chrome Extension for instant text-to-flowchart conversion and seamless collaboration.
查看详情